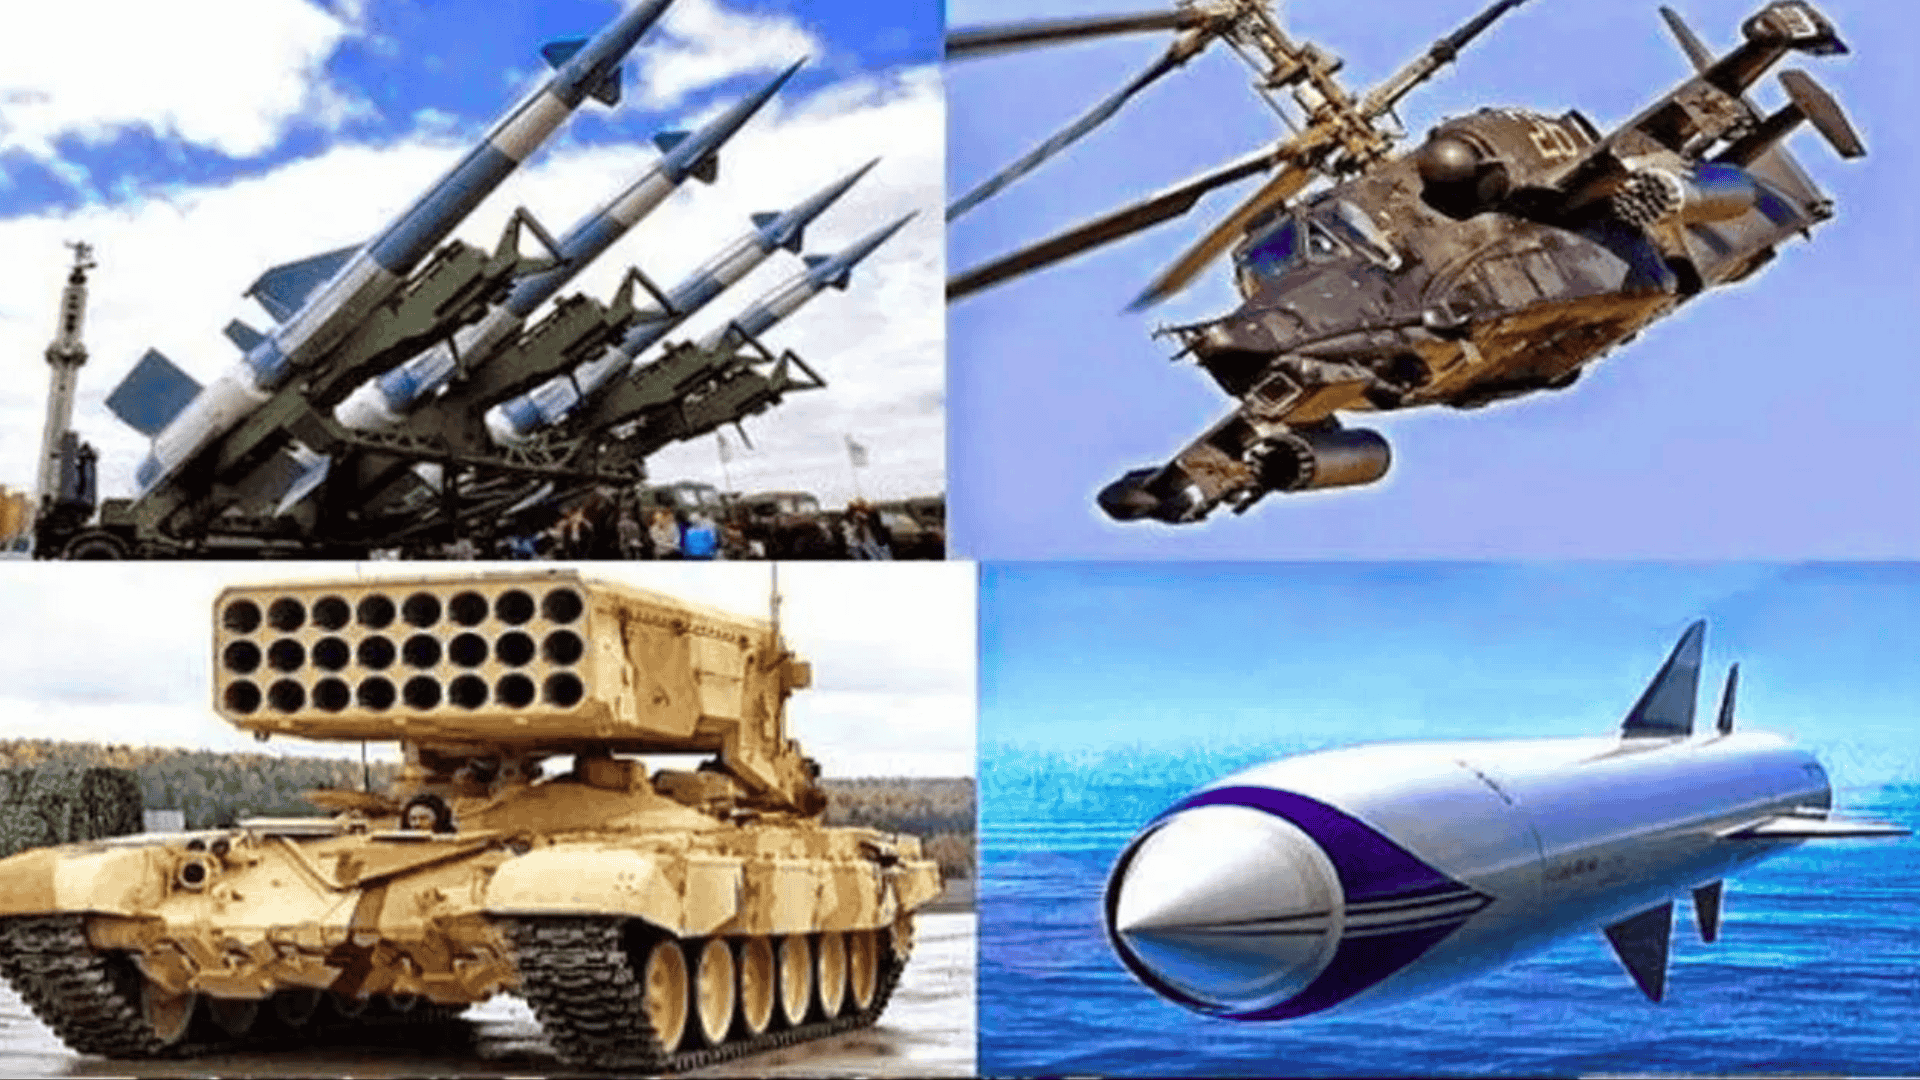
Introduction: The World in the Grip of Unprecedented Military Buildup
According to the latest report from the Stockholm International Peace Research Institute (SIPRI), released in April 2025, the world is witnessing the largest surge in military expenditure since the end of the Cold War. Global military spending reached a record $2.7 trillion (2,718 billion dollars) in 2024, which is 9.4% higher than in 2023 and marks the tenth consecutive year of growth. This rise is primarily due to ongoing conflicts in Ukraine and Gaza, as well as increasing tensions in the Indo-Pacific region.
With this surge in military spending, the arms industry has also rapidly grown. The combined revenue of the world’s top 100 arms companies reached $632 billion in 2023, a 4.2% increase from the previous year. These developments have a deep impact on international security and are extremely important for UPSC and other competitive examinations.
Trends in Global Military Expenditure: Data Analysis
Record Levels of Spending
Total Military Expenditure: $2.718 trillion (2024)
Share in Global GDP: 2.5%
Per Capita Expenditure: $334 (highest since 1990)
Increase between 2015-2024: 37%
100+ countries increased their military budgets
All top 15 spending countries increased their budgets
Regional Distribution
Europe: 17% increase (impact of Ukraine war)
Middle East: 15% increase (due to Gaza conflict)
All regions saw growth for the second consecutive year
Top Military Spenders: Dominance of Five Countries
USA: Leading the Pack
Expenditure: $997 billion (2024)
Global Share: 37%
Share in NATO Spending: 66%
Major Investments: F-35 aircraft, naval vessels, missile systems
China: Strategic Investment
Expenditure: $314 billion (2024)
Total arms company revenue: $103 billion
Russia: Wartime Spending
Expenditure: $149 billion (2024)
Increase from 2023: 38%
Share in GDP: 7.1%
Share in government spending: 19%
Germany: Leading in Europe
Expenditure: $88.5 billion (2024)
Increase from 2023: 28%
Global Rank: Fourth
India: Growing Defense Investment
Expenditure: $86.1 billion (2024)
Increase from 2023: 1.6%
Nine times higher than Pakistan
Global Arms Industry Revenue
Record Revenue of Top 100 Companies
Total Revenue: $632 billion (2023)
Increase from 2022: 4.2%
73 companies recorded revenue growth
Regional Distribution
USA: 41 companies, $317 billion (50% of total)
Europe: $133 billion
Asia-Oceania: $136 billion
Top 5 Arms Companies (All USA-based)
Lockheed Martin: $60.8 billion (F-35, PAC-3, C-130, THAAD)
RTX (formerly Raytheon): $40.7 billion (Patriot missiles, Tomahawk)
Northrop Grumman: $35.6 billion (B-21 bomber, UAV, missiles)
Boeing: $31.1 billion (F-15, F/A-18, Apache)
General Dynamics: $30.2 billion (M1A2 tank, submarines)
Major Arms Deals
USA-Saudi Arabia: $142 billion historic defense deal (largest ever)
USA-Qatar: Nearly $2 billion deal for MQ-9B drones
Qatar: Purchase of F-15, Apache helicopters, missile defense systems
India’s Position in Global Arms Trade
Dependence on Imports
Share in global imports: 8.3% (second place)
Ukraine at first place: 8.8% (due to war)
India’s challenge of achieving self-reliance
Domestic Defense Industry
Three Indian companies: HAL, BEL, MDL (total revenue $6.74 billion, 5.8% growth)
HAL: $3.7 billion (light combat aircraft, helicopters)
Relations with Major Exporters
France: 38% of exports to India
Russia: 34%
Israel: 28%
Geopolitical Impact and Security Scenario
Conflict-driven Spending
Ukraine: 34% of GDP spent on military (highest in 2024)
Military expenditure: $64.7 billion (all tax revenue spent on military)
Regional Security Competition
Asia-Pacific: South Korea (+39%), Japan (+35%), Taiwan (+27%)
Middle East: Israel’s spending up by 65% (Gaza war)
Economic-Social Impact
Military share in global government spending: 7.1%
Impact on other sectors: Reduced budget for education, health, etc.
Key Facts for Competitive Exams
Important Statistics
Global military expenditure: $2.718 trillion (2024)
Share in global GDP: 2.5%
Top 5 countries: 60% of total spending
Arms industry revenue: $632 billion (2023)
India’s expenditure: $86.1 billion (5th place)
India’s imports: 8.3% (second place)
Major Defense Deals
USA-Saudi Arabia: $142 billion
USA-Qatar: $2 billion (drones)
GE Vernova-Saudi Arabia: $14.2 billion (energy)
Regional Trends
Europe: 17% increase (Ukraine war)
Middle East: 15% (Gaza)
Growth in all regions
Why This Matters for Your Exam Preparation
Relevance for UPSC Mains
GS Paper-2 (International Relations): Understand changing global power balance, security alliances, and regional security complexities through military spending data.
GS Paper-3 (Internal Security): India’s defense self-reliance, Make in India, defense procurement complexities, strategic autonomy.
Economic-Social Impact: Resource allocation, opportunity cost, impact on social sectors.
Use in Current Affairs
Solid data for topics like modern security challenges, arms trade, defense budgets, international cooperation.
Essays and Interviews: Useful examples for topics like "Military-Industrial Complex," "Global Security Challenges," "India’s Strategic Autonomy."
Internal Links (Related articles on Atharva Examwise)
India’s Defence Policy and Self-Reliance
Recent Developments in International Relations
External Reference
Why this is crucial for your exam preparation
This topic is highly important for UPSC GS-2, GS-3, Essay, and Interview.
It will help you write answers with solid facts on global security, arms trade, India’s defense policy, and economic-social impact.
Be prepared for interview questions on contemporary security challenges, India’s defense relations, and strategic autonomy.
Note: In-depth understanding and data-based analysis of such current affairs topics can enhance your answer writing and increase your chances of selection.
For more UPSC current affairs and daily GK updates, visit Atharva Examwise.


