
UPSC Current Affairs July 2026: Retail Inflation Hits 19-Month High of 4.45% | Atharva Examwise Daily GK Update
Macroeconomic Trend: July 2026 Retail Inflation Acceleration
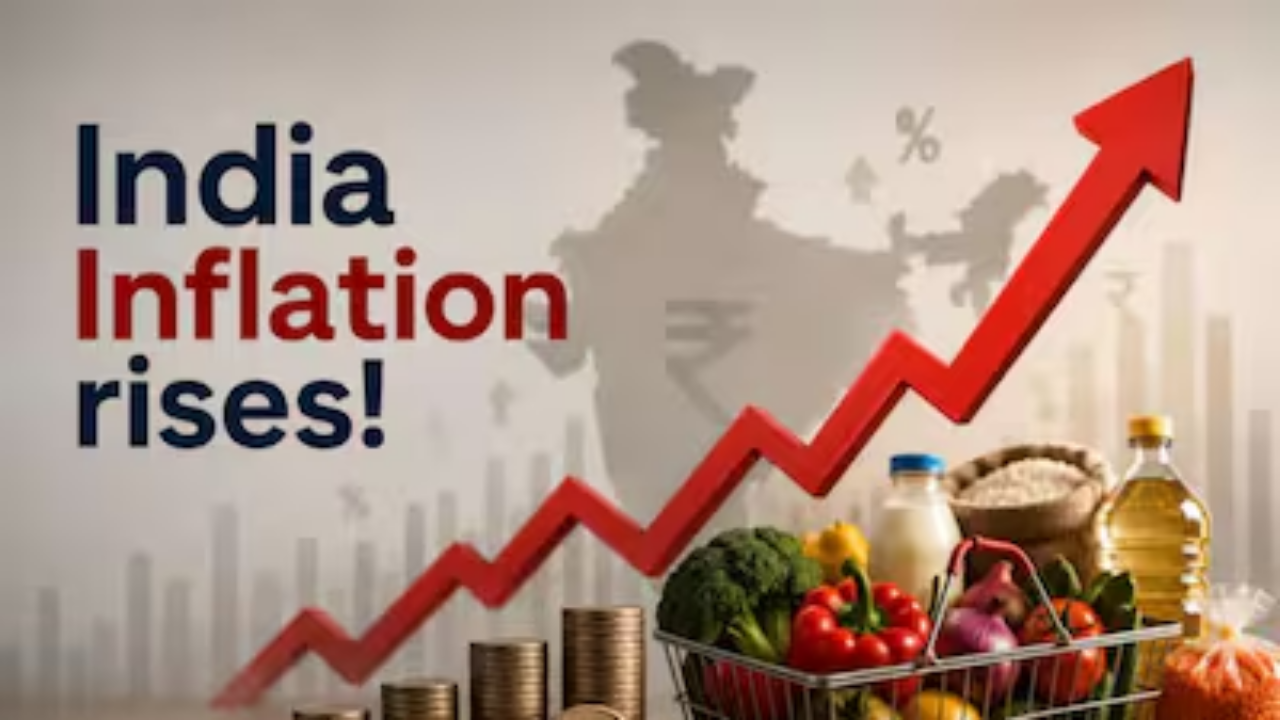
According to official macroeconomic data released by the Ministry of Statistics and Programme Implementation (MoSPI), India's retail inflation, measured by the Consumer Price Index (CPI), rose to a 19-month high of 4.45% in July 2026. This upward trajectory was principally driven by cost escalation across food and fuel segments, which transmitted secondary price pressures into dependent service industries. While certain discretionary and social service sectors demonstrated disinflationary tendencies, key components such as transport, food, and hospitality accelerated sharply during the month.
Aspirants tracking UPSC current affairs and competitive exam news today should note that MoSPI modernized the statistical architecture of the price index earlier this year by introducing 2024=100 as the new base year. Consequently, while aggregated headline CPI historical figures exist back to August 2021, sector-specific breakdown datasets under the revised classification are available starting from January 2026.
The Consumer Food Price Index (CFPI) quickened to 5.20% in July 2026 from 5.05% in June. This acceleration reflects significant price divergences across essential agricultural commodities. As noted by Rajeev Sharan, Head of Research at Brickwork Ratings, the food sub-index was propelled by fresh price spikes in onion and garlic alongside sustained elevation in ginger costs, even as staple vegetables like potato and tomato entered deflationary territory.
Detailed Sectoral Inflation Breakdown: July 2026
The table below outlines the movement of various commodity and service groups within the Consumer Price Index for July 2026 compared to June 2026, detailing the key operational factors driving these fluctuations.
| CPI Commodity / Service Category | June 2026 Inflation Rate (%) | July 2026 Inflation Rate (%) | Directional Trajectory | Operational Drivers & Market Determinants |
|---|---|---|---|---|
| All-India Headline CPI (Combined) | 4.38% | 4.45% | Quickened (+7 bps) | Broad-based food price spikes and downwardly inelastic fuel costs. |
| Food & Beverages (CFPI) | 5.05% | 5.20% | Quickened (+15 bps) | Volatility in onion, garlic, and ginger; imported edible oil cost spikes. |
| Restaurants & Accommodation | 6.90% | 7.70% | Quickened (+80 bps) | Higher energy and food input costs passed through by service providers. |
| Transport Sector | 4.30% | 4.40% | Quickened (+10 bps) | Elevated logistics overheads and persistent domestic retail fuel levels. |
| Healthcare Services | 1.40% | 1.30% | Moderated (-10 bps) | Extended disinflationary trend observed consistently since February 2026. |
| Recreation, Sport & Culture | 1.75% | 1.60% | Moderated (-15 bps) | Muted discretionary consumer expenditure across urban centers. |
| Personal Care & Miscellaneous | >14.80% | 14.80% | High (Lowest in 2026) | Elevated bullion and precious metal prices (gold and silver). |
For additional primary data maps and state-level inflation metrics, aspirants can consult the official MoSPI Data Visualization Portal.
Key Drivers: Agricultural Dynamics, Energy Inelasticity, and Global Factors
Multiple structural and temporal shocks converged to push retail price levels higher in July 2026:
Monsoon Disruptions and Agrarian Shifts: Madan Sabnavis, Chief Economist at Bank of Baroda, highlighted that while monsoon rainfall recovered substantially across key agricultural regions in July, localized crop damage was reported. The combination of crop damage and longer cropping cycles is expected to delay harvests and maintain upward pressure on pulse prices.
Global Edible Oil Price Pass-Through: High international benchmark prices for edible oils continue to spill over into Indian retail markets, reinforcing domestic food inflation.
Downward Fuel Price Inelasticity: Geopolitical conflicts and global supply uncertainties have kept energy prices elevated. Although international fuel supplies have shown signs of normalization, domestic retail prices remain rigid in the downward direction.
Secondary Cost-Push Transmission: High energy costs have forced hospitality units to raise prices, driving inflation in the restaurant and accommodation segment to a yearly high of 7.70% in July 2026.
The Revised CPI Base Year 2024 Framework
Understanding the revised Consumer Price Index architecture is essential for candidates studying Indian Economy for UPSC CSE GS Paper III. MoSPI updated the CPI base year from 2012=100 to 2024=100 earlier this year to better capture modern consumer behavior. Detailed analysis on the methodology can be explored in the Atharva Examwise CPI Base Year Guide.
The statistical reform incorporates several major updates:
Updated Weighting Diagram: Base-year expenditure weights are derived from the Household Consumption Expenditure Survey (HCES) 2023–24 using the Mixed Modified Reference Period (MMRP).
Expanded Item Basket: The total number of weighted items in the basket increased from 299 to 358 items, incorporating digital goods and modern services.
Enhanced Market Coverage: Data collection now includes e-commerce platforms alongside physical markets, reflecting urban retail expansion.
Global Harmonization: The 2024 series aligns with the United Nations Classification of Individual Consumption According to Purpose (COICOP) 2018 framework, organized into 12 Divisions, 43 Groups, 92 Classes, and 162 Subclasses.
Mathematical Compilation: The index continues to use Laspeyres' Index Formula to compare monthly price movements collected by the NSO Field Operations Division against base-year averages.
The table below contrasts the legacy 2012 series with the updated 2024 series:
| Feature / Metric | Legacy Series (Base 2012=100) | Updated Series (Base 2024=100) |
|---|---|---|
| Reference Base Year | 2012=100 | 2024=100 |
| Underlying Survey | HCES 2011–12 | HCES 2023–24 |
| Basket Size | 299 weighted items | 358 weighted items |
| International Classification | COICOP Legacy Standard | UN COICOP 2018 (12 Divisions, 43 Groups) |
| Data Outlets Covered | Traditional rural & urban markets | Physical markets + E-commerce platforms |
Aspirants seeking a deeper dive into household spending metrics can read the Atharva Examwise HCES Survey Analysis.
Monetary Policy Implications for the Reserve Bank of India
Under the statutory Flexible Inflation Targeting (FIT) framework established under the RBI Act, 1934, the Reserve Bank of India aims to keep headline CPI inflation at a target of 4.00% with a tolerance band of +/- 2.00% (2.00% to 6.00%). While July's headline figure of 4.45% remains within the permissible upper boundary of 6.00%, its move above the 4.00% target limits the Monetary Policy Committee's (MPC) scope for policy rate reductions.
Because supply-side bottlenecks in agricultural commodities and downwardly sticky fuel prices drive current price pressures, standard monetary tightening tools—such as raising the repo rate—have limited efficacy against exogenous supply shocks. The MPC must balance controlling secondary cost inflation in services against supporting domestic economic growth. Further background on central bank operations is available in the Atharva Examwise Monetary Policy Guide.
Why this matters for your exam preparation
Retail inflation and price index methodology are high-yield topics across competitive examinations. Candidates preparing for UPSC CSE, State PCS, and banking exams must understand both the headline data and underlying structural economic principles.
Key Exam-Relevant Facts and Data Points
Headline CPI Inflation: Rose to a 19-month high of 4.45% in July 2026.
Food & Beverages Inflation: Quickened to 5.20% in July 2026 from 5.05% in June.
Highest Sectoral Inflation: Restaurants and accommodation services at 7.70%; personal care & miscellaneous items at 14.80%.
Lowest Sectoral Inflation: Healthcare cooling to 1.30% and recreation at 1.60%.
CPI Base Year: Updated to 2024=100, expanding basket items from 299 to 358.
Statistical Framework: Aligned with UN COICOP 2018 across 12 Divisions and calculated using Laspeyres' Index Formula based on HCES 2023–24 weights.
Relevance for UPSC CSE Prelims & Daily GK
CPI vs. WPI Comparison: CPI measures retail price changes for goods and services consumed by households, whereas the Wholesale Price Index (WPI) measures producer-level prices for goods only. CPI carries a higher weight for food items than WPI and includes services, making it the primary headline inflation metric adopted by the RBI for inflation targeting.
Base Year Revisions: Questions frequently assess base years across macroeconomic indicators (CPI: 2024=100; IIP: 2022–23=100; GDP: 2022–23=100).
Relevance for UPSC CSE Mains (GS Paper III: Indian Economy)
Inflation Dynamics & Monetary Policy: Questions in GS Paper III test the trade-off between supply-side food inflation and monetary policy interventions.
Agricultural Supply Chains: Understanding how monsoon variability, longer cropping cycles, and global edible oil trends impact domestic retail prices helps aspirants construct structured answers on agricultural marketing and food security.
Data Reforms & Policy Integrity: Modernizing statistical indices using HCES data ensures evidence-based policymaking, transparent economic monitoring, and international comparability.