Date: December 03, 2025
Category: Environment & Ecology / Science & Tech
With winter setting in, terms like "Severe," "Hazardous," and "PM2.5" dominate the headlines. The Air Quality Index (AQI) is more than just a number; it is a critical "report card" for the air we breathe. Whether caused by vehicular traffic, industrial emissions, stubble burning, or construction dust, the AQI summarizes the complex mixture of pollutants into a single metric.
For aspirants preparing for UPSC current affairs and other competitive exams, understanding the technicalities, history, and categorization of AQI is vital for General Studies Paper III (Environment) and Prelims.
What is the Air Quality Index (AQI)?
The AQI is a tool used by government agencies to communicate to the public how polluted the air currently is or how polluted it is forecast to become. It transforms complex air quality data into a single number (index value), nomenclature, and color.
The 6 Major Pollutants
The AQI is calculated based on the concentration of several key pollutants. The primary six include:
PM 2.5 (Particulate Matter 2.5): Ultra-fine particles.
PM 10 (Particulate Matter 10): Coarse particles.
Nitrogen Dioxide ($NO_2$)
Sulfur Dioxide ($SO_2$)
Ozone ($O_3$)
Carbon Monoxide ($CO$)
Key Fact: PM 2.5 is considered the most dangerous. These particles are so microscopic that approximately 30 of them can fit across the width of a single human hair. They can bypass the body's defenses, entering the lungs and bloodstream directly.
How is AQI Measured?
The measurement process has become highly sophisticated. Cities are equipped with Air Quality Monitoring Stations where sensors continuously sample the air to measure particle density and gas levels.
The Concept of the "Dominant Pollutant"
Computer models analyze the data every hour. A crucial concept for competitive exam news today is how the final score is derived:
The AQI is not an average of all pollutants.
It is determined by the pollutant with the highest index value at that time.
This is called the "Dominant Pollutant."
Example: If PM 2.5 levels are "Hazardous" but all other gases are "Good," the overall AQI will reflect the hazardous PM 2.5 level.
This explains why the sky might look clear to the naked eye, but the AQI app shows a red warning—microscopic particles like PM 2.5 are invisible but deadly.
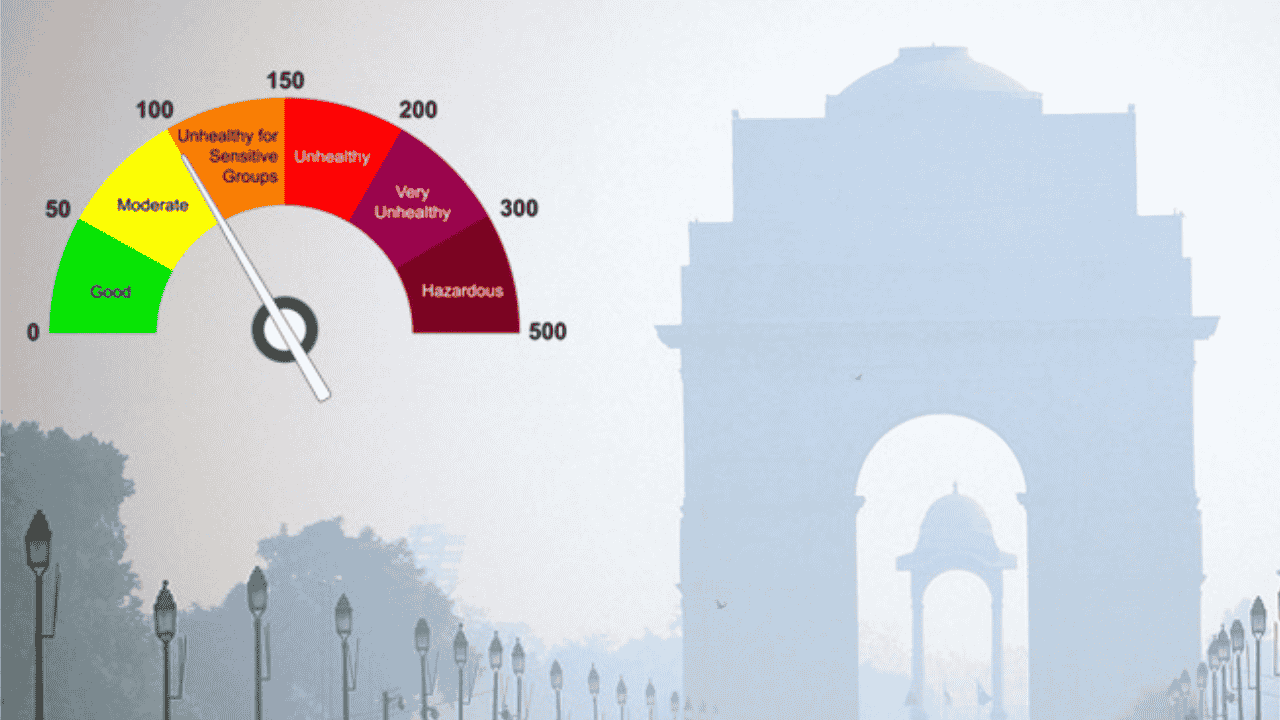
Decoding the Color Spectrum: AQI Categories
To make the data accessible to the general public (a key objective of UPSC current affairs topics), a color-coded system is used.
0–50 (Green): Good. Air quality is satisfactory; poses little or no risk.
51–100 (Yellow): Satisfactory. Acceptable quality. However, there may be a moderate health concern for a very small number of people who are unusually sensitive to air pollution (e.g., those with asthma).
101–150 (Orange): Unhealthy for Sensitive Groups. Members of sensitive groups may experience health effects. The general public is not likely to be affected.
151–200 (Red): Unhealthy. Everyone may begin to experience health effects (coughing, eye irritation, headache); members of sensitive groups may experience more serious health effects.
201–300 (Purple): Very Unhealthy. Health warnings of emergency conditions. The entire population is more likely to be affected.
301+ (Maroon): Hazardous. Emergency conditions. Everyone may experience more serious health effects. Outdoor exertion should be avoided entirely.
According to the World Health Organization (WHO), nearly 90% of the global population breathes air that exceeds pollution limits.
Historical Background: Who Invented the AQI?
For the history segment of your daily GK update, note that the AQI was introduced in 1968 in the United States.
Developer: National Air Pollution Control Administration (USA).
Objective: To create a simple, number-based scale to measure pollution and raise public awareness.
Purpose: It acts as a "Public Information Tool" to help citizens understand safety levels and put pressure on authorities to control emissions.
Why is this System Important?
The AQI serves as an early warning system. It triggers specific policy responses (like the Graded Response Action Plan - GRAP in Delhi-NCR).
Public Health: Advises sensitive groups (children, elderly, asthmatics) to stay indoors.
Administrative Action: When the AQI hits "Red" or "Purple," authorities may close schools, halt construction work, and restrict vehicular movement.
Why this matters for your exam preparation
For UPSC Prelims:
Pollutants: Memorize the specific pollutants monitored (PM2.5, PM10, $NO_2$, $SO_2$, $O_3$, CO, $NH_3$, Pb).
Origin: Know the historical context (1968, USA) and the agency responsible in India (Central Pollution Control Board - CPCB).
Ozone Formation: Understand that ground-level ozone is not emitted directly but formed by chemical reactions between oxides of nitrogen (NOx) and volatile organic compounds (VOC) in the presence of sunlight.
For UPSC Mains (GS Paper III):
Environmental Pollution: Use AQI data to substantiate answers regarding urban planning, industrial regulation, and health crises.
Policy Making: Analyze the effectiveness of AQI-triggered responses like GRAP versus long-term mitigation strategies.
Stay tuned to Atharva Examwise for your daily dose of competitive exam news and comprehensive analysis.