
UPSC Current Affairs October 31, 2026: India Records World's Fastest Poverty Decline in World Bank Report | Atharva Examwise Current News, Daily GK Update & Competitive Exam News Today
Executive Summary: World Bank October 2026 Poverty and Equity Brief
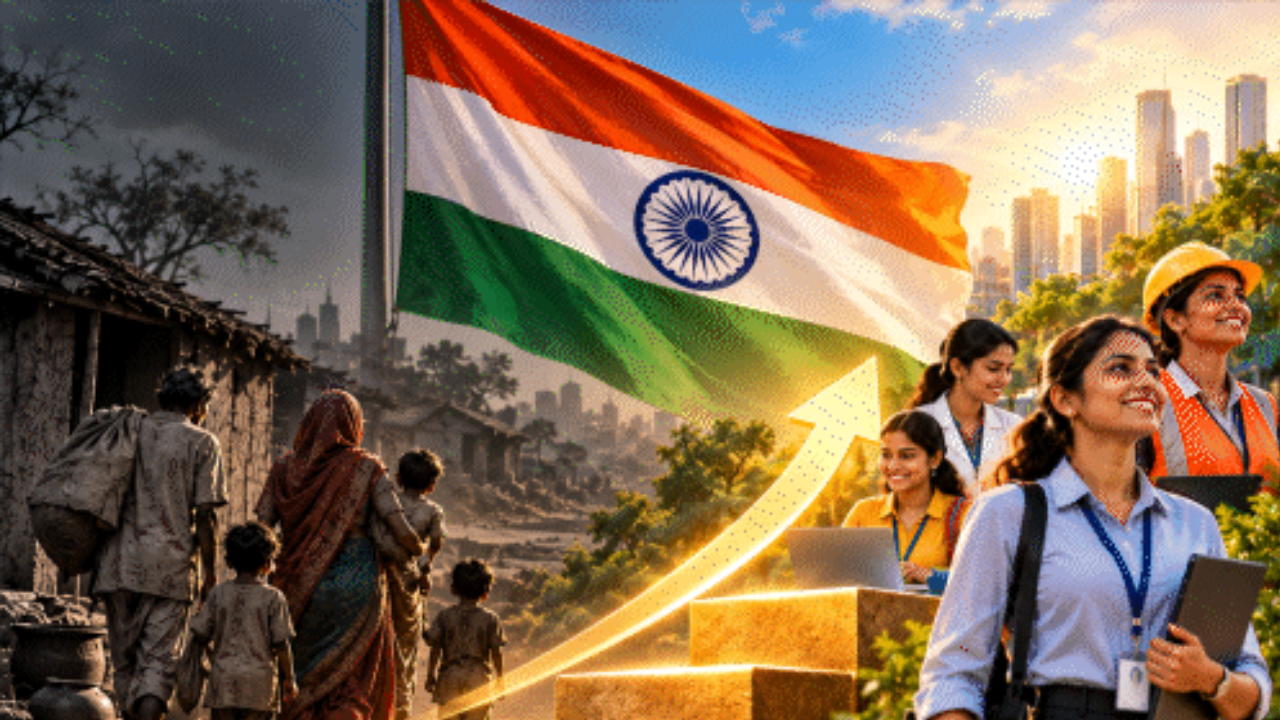
India has achieved one of the fastest rates of poverty reduction globally, lifting an estimated 496 million (49.6 crore) citizens out of moderate poverty between 2011 and 2023. According to the World Bank Poverty and Equity Brief released in October 2026, the proportion of India's population living in extreme monetary poverty plummeted more than tenfold, dropping from 27.1% in 2011–12 to 2.6% in 2023–24. For civil services aspirants tracking UPSC current affairs and competitive exam news today, this landmark assessment provides updated empirical benchmarks derived from the National Sample Survey Office (NSSO) Household Consumption Expenditure Surveys (HCES).
The World Bank evaluation demonstrates that poverty alleviation in India has been both deep and multidimensional. Beyond basic survival metrics, the share of the population living below the lower-middle-income country (LMIC) threshold of $4.20 per day—measured at 2021 Purchasing Power Parity (PPP)—contracted from 57.7% in 2011 to 16.1% in 2023. Concurrently, non-monetary deprivation across health, education, and civic amenities registered historic declines. However, the macro-level trajectory is accompanied by structural labor market challenges, including stagnant real wages, low-productivity employment concentration, regional clustering of deprivation across the Gangetic plain, and an uptick in youth unemployment. Aspirants utilizing the Atharva Examwise Current Affairs portal must evaluate both these welfare gains and the underlying developmental bottlenecks for upcoming General Studies papers.
Key Facts and Exam-Relevant Data for Prelims and Mains
Aspirants preparing for UPSC Prelims, Mains GS Paper-II, GS Paper-III, and State Civil Services can consolidate the following high-yield statistical findings from the World Bank report:
Extreme Poverty Eradication ($3.00/day PPP): The share of India's population living below the international extreme poverty threshold of $3.00 per person per day (at 2021 PPP, equivalent to roughly ₹58 in 2021 prices) fell from 27.1% in 2011–12 to 5.3% in 2022–23, and halved again to 2.6% in 2023–24.
Population Lifted from Extreme Deprivation: Between 2011 and 2023, approximately 307 million (30.7 crore) individuals exited extreme poverty, representing an annualized reduction of roughly 2 percentage points (or an 18% annual rate of decline). Currently, an estimated 7.5 crore people remain below the $3.00/day benchmark.
Lower-Middle-Income Poverty ($4.20/day PPP): Measured against the LMIC poverty line of $4.20 per day (at 2021 PPP, equivalent to roughly ₹82 in 2021 prices or approximately ₹400 in current nominal terms), India's moderate poverty rate dropped from 57.7% in 2011 to 16.1% in 2023, reflecting an annualized drop of 3.5 percentage points.
Record Volume of Poverty Alleviation: The decline at the $4.20/day threshold lifted 496 million (49.6 crore) people above the poverty line over 12 years—a population volume roughly 150 million larger than the total population of the United States. Depending on survey population weights, between 23.3 crore and 34 crore individuals remain below this threshold.
Upper-Middle-Income Poverty ($8.30/day PPP): Against the $8.30 per day benchmark applicable to upper-middle-income economies, approximately 115 crore Indians remain below the threshold, underscoring the per-capita income transition required to achieve the Viksit Bharat (Developed Nation) target by 2047.
Future Poverty Projections (2026–2028): World Bank microsimulations indicate that moderate poverty ($4.20/day) will continue to fall, though at a more gradual pace, declining from 14.2% in 2026 to 12.1% by 2028.
Reduction in the Depth of Poverty (Poverty Gap Index / FGT-1): The Foster-Greer-Thorbecke ($FGT_1$) poverty gap—which quantifies the average consumption shortfall relative to the poverty line across the population—contracted from 16.1% to 2.6% for moderate poverty and from 2.6% to 0.7% for extreme poverty between 2011 and 2023.
Multidimensional Poverty Index (MPI) Gains: According to the Oxford Poverty and Human Development Initiative (OPHI), non-monetary multidimensional poverty in India fell from 53.8% in 2005–06 to 28.0% in 2015–16, and further to 16.4% in 2019–21. Under the World Bank's own multidimensional poverty measure, deprivation stood at 15.5% in 2022–23.
Employment Expansion (2017–2023): India added 134 million (13.4 crore) employed individuals between 2017 and 2023—nearly twice the expansion of its working-age population—primarily driven by rural women entering paid economic activities.
Consumption Inequality vs. Wage Disparity: India's consumption-based Gini index improved from 28.8 in 2011–12 to 25.5 in 2022–23 and 23.0 in 2023–24. Conversely, labor market data reveals that median earnings among the top 10% of workers were 13 times higher than those of the bottom 10% in 2023.
Decoding the World Bank Methodology: PPP Benchmarks and the Depth of Poverty
A thorough grasp of poverty estimation methodology is vital for candidates utilizing Atharva Examwise Study Material to prepare for Indian Economy modules. The World Bank evaluates monetary poverty across nations using Purchasing Power Parity (PPP) exchange rates compiled by the International Comparison Program (ICP), rather than market exchange rates, to eliminate price-level distortions across countries. While the nominal rupee-dollar market exchange rate hovers near ₹95 per US dollar—which would make $3.00 equivalent to ₹285—the ICP PPP conversion factor for India was 20.09 in 2025, reflecting the substantially lower domestic cost of non-tradable goods and services in India compared to the United States.
| World Bank Classification | Daily Threshold (2021 PPP) | Baseline Value in Indian Rupees | 2011–12 Headcount Ratio | 2023–24 Headcount Ratio | Estimated Population Below Line (2023–24) |
|---|---|---|---|---|---|
| International Extreme Poverty Line | $3.00 per day | ~₹58 (at 2021 prices) | 27.1% | 2.6% | ~7.5 Crore (75 Million) |
| Lower-Middle-Income (LMIC) Line | $4.20 per day | ~₹82 (2021 prices) / ~₹400 (current) | 57.7% | 16.1% | ~23.3 Crore to 34 Crore |
| Upper-Middle-Income (UMIC) Line | $8.30 per day | Adjusted to 2021 PPP basket | Not Applicable | Majority of Population | ~115 Crore (1.15 Billion) |
Beyond the standard headcount ratio ($FGT_0$), the World Bank emphasizes the Poverty Gap Index ($FGT_1$), expressed mathematically as:
$$FGT_1 = \frac{1}{N} \sum_{i=1}^{q} \left( \frac{z - y_i}{z} \right)$$
Where $N$represents the total population,$q$is the number of poor individuals,$z$is the poverty line, and$y_i$is the consumption expenditure of the$i$-th poor individual. The contraction of India's moderate poverty gap from 16.1% to 2.6% carries profound fiscal implications. It demonstrates that not only has the absolute number of poor people fallen, but those who remain below the$4.20/day threshold are now concentrated much closer to the poverty line. Consequently, the minimum fiscal resource transfer required to eradicate remaining moderate poverty under perfect administrative targeting has shrunk to a fraction of its 2011 level.
The Statistical Nuance: Welfare Gains vs. Survey Instrumentation
An analytical reading of the World Bank data reveals a sharp single-year halving of extreme poverty from 5.3% in 2022–23 to 2.6% in 2023–24. Because 2022–23 and 2023–24 represent two consecutive NSSO HCES survey rounds whose sociodemographic sample compositions—including household size, demographic structure, caste, religion, education, and employment type—remained stable, simple mechanical sampling errors have been ruled out by World Bank diagnostics. Instead, the World Bank attributes this steep one-year decline to a combination of genuine bottom-decile welfare growth and refined survey implementation during the second consecutive year of data collection, which enabled field enumerators to more accurately capture household expenditure across food, non-food items, services, and consumer durables.
Three Core Drivers of India's Poverty Alleviation
The World Bank attributes India's rapid exit from extreme deprivation to three mutually reinforcing structural mechanisms: pro-poor consumption expansion, rural female workforce entry, and targeted social protection transfers.
1. Pro-Poor Household Consumption Growth
Between 2011 and 2023, India experienced sustained, broad-based growth in per-capita household expenditure that favored the bottom deciles of the distribution. Rising purchasing power allowed families at the base of the economic pyramid to diversify their consumption baskets beyond staple cereals toward higher-value nutritional items, healthcare, education, transportation services, and durable household assets.
2. Rural Female Labor Force Participation
Between 2017 and 2023, the Indian economy generated approximately 134 million (13.4 crore) new employment opportunities—nearly double the rate of growth of the working-age population over the same period. The single most decisive demographic shift within this expansion was the large-scale entry of rural women into paid economic roles. By adding secondary and tertiary earners within rural families, female workforce participation directly raised aggregate household incomes and reduced household economic dependency ratios.
3. Expansion of Social Protection and Direct Benefit Transfers
The institutionalization of Direct Benefit Transfers (DBT) alongside universalized food security programs created a resilient consumption floor for vulnerable citizens. Government-funded free foodgrain distribution and direct bank transfers shielded low-income households from macroeconomic shocks and food inflation, effectively subsidizing basic caloric needs and freeing up disposable household income for non-food expenditure.
Non-Monetary Deprivation: Saturation of Basic Amenities
Poverty is not merely a deficit of monetary income; it encompasses capability deprivation across health, education, and living standards, which are captured through the Multidimensional Poverty Index (MPI). Both the OPHI Multidimensional Poverty Index—which dropped from 53.8% in 2005–06 to 28.0% in 2015–16 and 16.4% in 2019–21—and the World Bank's own multidimensional poverty measure at 15.5% in 2022–23 confirm that non-monetary welfare improvements have closely paralleled monetary gains.
This structural transformation reflects the near-saturation of public service delivery targeting basic civic infrastructure across rural and urban households. Over the past two decades, expanded access to all-weather pucca housing, household electrification, clean cooking gas (LPG), safe drinking water, and household sanitation facilities has systematically dismantled the non-monetary dimensions of deprivation, elevating basic living standards even in regions where cash incomes remain modest.
Structural Paradoxes and Developmental Challenges
Despite historic progress in eliminating extreme deprivation, the World Bank report highlights critical structural vulnerabilities across regional geography, labor market productivity, and wage distribution that require policy intervention as India transitions toward upper-middle-income status.
1. Spatial and Sectoral Concentration of Deprivation
Poverty reduction across India remains geographically and demographically uneven. At the $4.20/day threshold, rural poverty stood at 19.3% in 2023, more than double the 8.6% recorded in urban areas. While rural areas achieved a larger absolute annual reduction between 2011 and 2023—declining by 3.8 percentage points annually compared to 2.6 percentage points in urban centers due to a substantially higher initial baseline—urban poverty fell at a faster proportional pace of 12% annually compared to 10% in rural areas. Geographically, 57% of India's poor population is concentrated within a contiguous spatial belt stretching from Uttar Pradesh to West Bengal. Across these regions, remaining deprivation has become increasingly concentrated among vulnerable households characterized by lower educational attainment, fewer physical assets, higher dependency ratios, and limited access to stable, non-farm employment. Aspirants preparing for state-level civil services via the Atharva Examwise State PCS Portal and the MPPSC Coaching Platform should incorporate these spatial disparities into regional economic analyses.
2. The Employment Quantity vs. Quality Paradox
Although the Indian economy absorbed 134 million additional workers between 2017 and 2023, this quantitative expansion failed to generate commensurate wage growth. The World Bank observes that real earnings remained broadly stagnant over the period because employment creation was heavily concentrated in relatively low-productivity activities. Furthermore, while overall labor market conditions proved broadly resilient, youth unemployment rose from 14.6% in the first quarter of FY2025–26 to 15.9% in the corresponding quarter of FY2026–27, with young rural women experiencing disproportionate unemployment pressures. Sustaining poverty reduction toward 2028 will therefore depend on shifting workers out of low-yield agricultural and informal work into higher-productivity non-farm employment.
3. Reconciling the Gini Index (23.0) with the 13x Wage Gap
A crucial analytical question for UPSC Mains is how India can simultaneously record a low consumption Gini index of 23.0 in 2023—down from 28.8 in 2011–12 and 25.5 in 2022–23, on a 0-to-100 scale where 0 represents perfect equality—while the median earnings of the top 10% of workers stand at 13 times those of the bottom 10%. This divergence stems from fundamental differences in measurement scope and survey coverage. First, India's Gini index evaluates household consumption expenditure rather than income or wealth, and consumption distributions are naturally compressed at the bottom by subsidized food transfers and at the top by higher household savings propensities. Second, the Gini coefficient captures dispersion across the entire population distribution, whereas the 13-times wage gap specifically compares median worker earnings at the top and bottom decile tails. Finally, the World Bank explicitly cautions that household consumption surveys do not fully capture expenditure among wealthier households, which systematically understates true inequality in the reported Gini metric.
Why this matters for your exam preparation
Why this matters for your exam preparation is evident across all three stages of the UPSC Civil Services Examination (Prelims, Mains, and the Personality Test) as well as State PCS examinations. For UPSC Prelims, objective questions frequently test technical poverty methodologies, including the World Bank's 2021 PPP thresholds ($3.00/day for extreme poverty, $4.20/day for lower-middle-income countries, and $8.30/day for upper-middle-income countries), the methodological distinction between the OPHI Multidimensional Poverty Index and the World Bank MPI, the Gini index, and the Foster-Greer-Thorbecke ($FGT_1$) Poverty Gap Index.
In UPSC Mains General Studies Paper-II (Governance, Welfare Schemes, and Social Justice), the empirical confirmation that expanded social transfers, food subsidies, and civic infrastructure drove extreme poverty down from 27.1% to 2.6% provides authoritative evidence when evaluating the efficacy of Direct Benefit Transfers (DBT) and last-mile public service delivery. In General Studies Paper-III (Indian Economy, Inclusive Growth, and Employment), the juxtaposition of 134 million new jobs against stagnant real wages, a 13x decile earnings gap, and 15.9% youth unemployment equips candidates with a balanced, data-driven argument on why India must transition from social-transfer-led poverty alleviation to high-productivity non-farm job creation. Furthermore, the finding that 57% of India's poor reside in the contiguous belt from Uttar Pradesh to West Bengal offers high-impact empirical grounding for Mains essays on balanced regional development and cooperative federalism. For structured concept-first lectures, daily MCQ practice, and downloadable revision mind maps on Indian Economy and Current Affairs, aspirants can explore the comprehensive courses available on the Atharva Examwise Official Platform.